
Optimizing the Only KPI that Matters: g

Ever try doing a Discounted Cash Flow analysis on a startup? For those of you who’ve taken Corporate Finance, the equation for determining the present value of a business looks something like this:
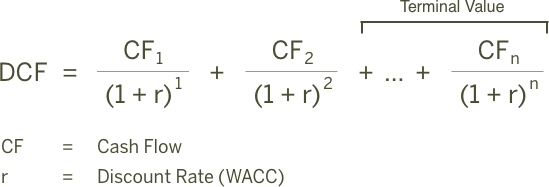
Safe to say, it doesn’t really work for startups. As I’ve said previously, without significant amounts of capital on hand to fund the business over the long-term, a DCF analysis of a startup is likely to return a valuation of zero.
That’s not to say the DCF equation doesn’t work; but in relation to startups it’s so heavily levered to “terminal value” given the many years of near-term negative cash flows, the exercise becomes relatively meaningless.
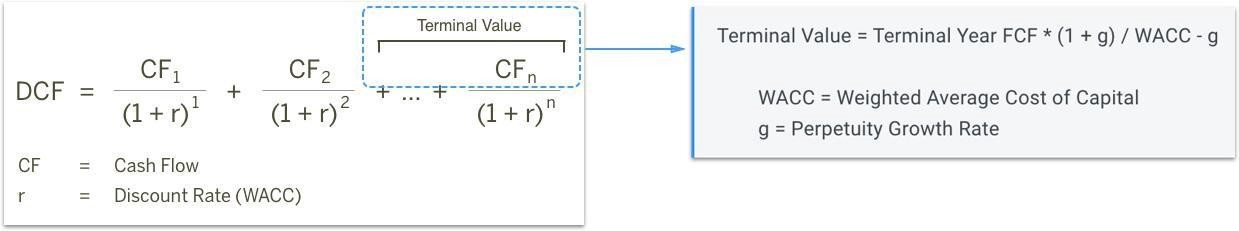
Despite the weakness of the exercise, the output is no less true:
A seed-stage business is only worth something today if we think “g” is a big number.
Therefore as an investor, all I care about is g. Sure, there’s a lot of important stuff along the way, but at the end of the day, an investment thesis is only as good as the long-run projected growth metrics.
• • •
So how do we maximize “g”. If you remember back to your old Economics classes, production output comes in three stages: increasing returns, decreasing returns, and negative returns.

A textbook style representation of production curves
Any given startup lives in Stage 1, at the extreme left end of the curve in hyper-growth mode, and the current state of it’s technology determines where the end of Stage 1 is (the point at which the business begins to see diminishing returns to sales and marketing). Investment in product development — such as new features or product lines — pushes that inflection point to the right, and further investment in sales and marketing pushes a company along the curve generating output (not necessarily revenue).
Over-investment in sales before the product offering expands to meet a wider set of potential customers will lead to diminishing returns on growth capital. Over-investing in product without the customer acquisition to support it, and you won’t generate meaningful output. This leads to an unrefutable fact:
Sub-optimal budgeting leads to sub-optimal growth.
Therefore, a CEO’s most significant unit economic on her dashboard should be the rate of growth. Diminishing returns on sales investment is a signal to shift investment to product and broaden the user base, while increasing rates of return on sales should provide a clear roadmap to investing more in customer acquisition.
Problem is, most KPI dashboards emphasize focus on static metrics, like LTV, CAC, Churn, MRR, ARPU, and Payback Periods. They act very much like true “dashboards”, telling you a snapshot of your current rate of speed, rather than acknowledging whether you’re applying the gas or tapping the brakes. These are all important metrics, but viewed in a vacuum they only tell you what the business is going to look like next month if everything else remains the same.
Growth lives in the 2nd derivative. Investors shouldn’t care what your CAC is so much as how it moves relative to where you’re at today. In understanding that — an investor can better see how a cash infusion will change the business from its current run-rate, and whether or not the environment you’re operating in can sustain long periods of sustained growth.
• • •
To give an example, I’ve attached a fictionalized data set that closely resembles a typical growth chart. An investor will typically hear something like:
“We’ve grown our user base by over 2x in the first 10 months of the year, and our CACs are steadily declining. This is indicative of the fact that we’ve found product-market fit and we’re ready to start scaling marketing spend”
Note: For this example, let’s assume $ spent on marketing only has an impact on sales during the same calendar month.
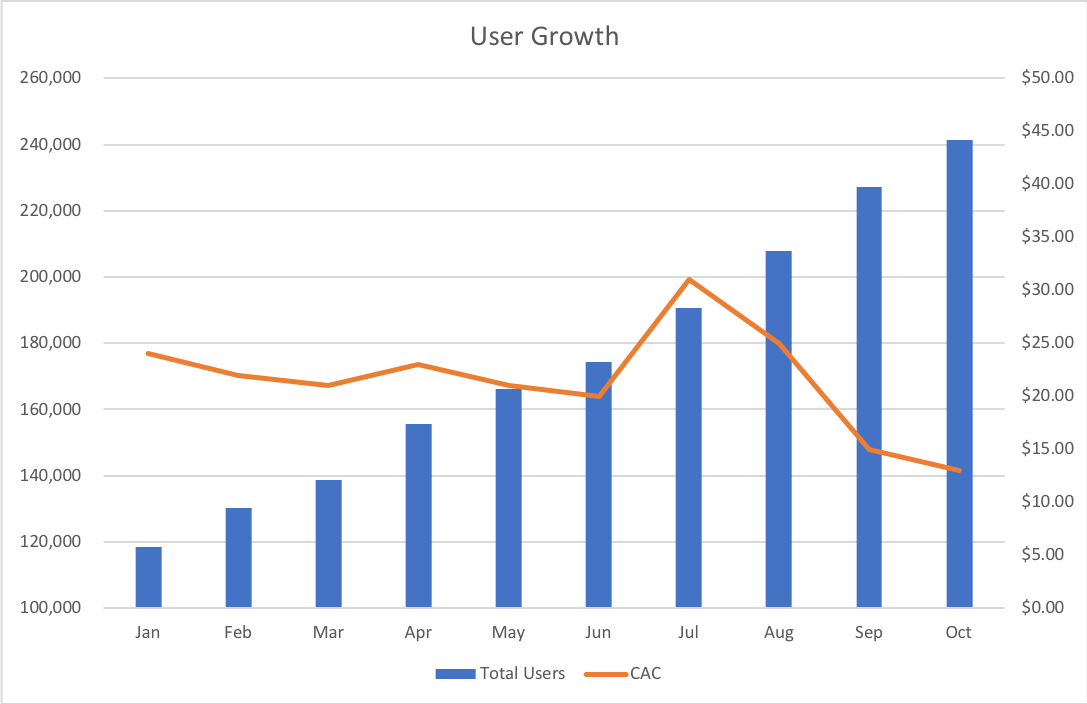
At first glance, we see a user chart is going up and to the right, while the CAC data is trending downwards; two trends that typically mean great things over the long term for the business. However, the CEO’s conclusion that “we’re ready to scale spending” is entirely wrong based on where their 2nd derivative indicators.
The first red flag is that CAC is highly correlated to marketing spend despite relatively low monthly marketing spend (in the grand scheme of building billion dollar businesses).
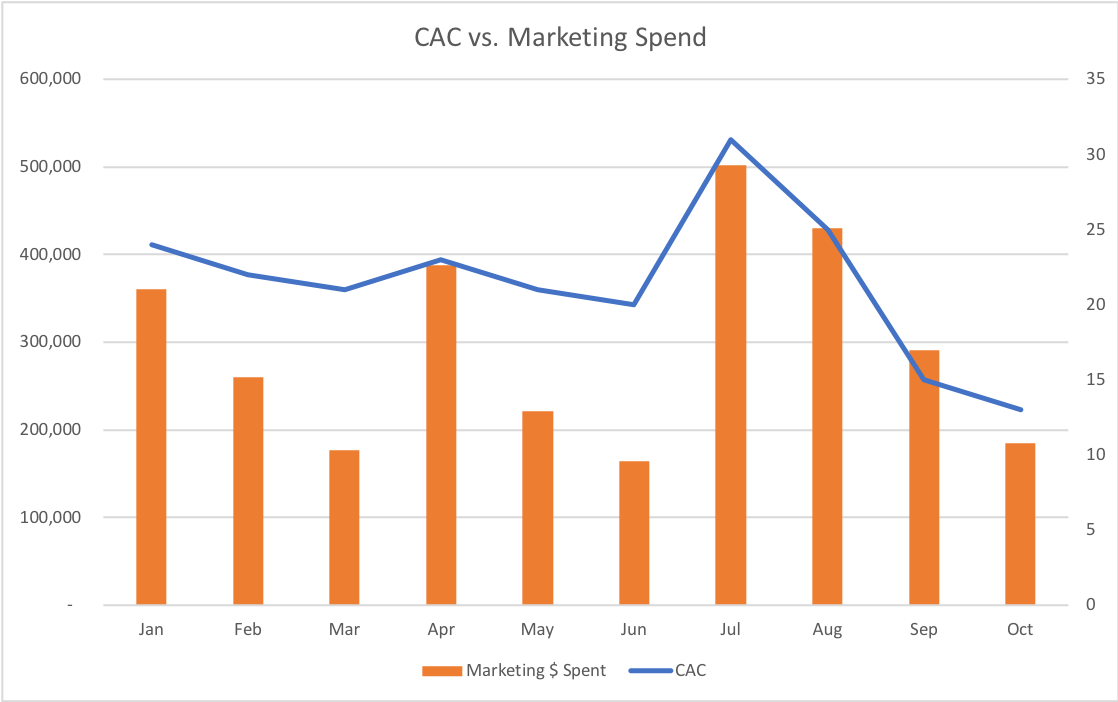

Correlation Coefficients:
CAC & Marketing: 0.75
Marketing & User Growth: 0.66
Of course this is only a correlation and not in itself damning, but the relationship points to a business highly reliant on paid-marketing to acquire users far more than it’s able to rely on organic or network-based user-acquisition.
With that in mind, you a deeper dive into the data shows an accelerating Marginal CAC rate. The distinction here being:
CAC = The average cost of user acquisition.
Marginal CAC = Cost of acquiring the next user.
The clearest example of this business’s marginal CAC is shown from June to July.
May: Marketing Spend $221,214 Users Acquired 10,534
June: Marketing Spend $163,620 Users Acquired 8,181
July: Marketing Spend $501,797 Users Acquired 16,187
June Marginal CAC = Marketing Delta ($57,594) / User Delta (2,353) = $24.48
July Marginal CAC = Marketing Delta $338,177 / User Delta 8,006 = $42.24
In the case of this company, the business proved that by effectively doubling the marketing spend to only $500k/mo, they’re seeing their user acquisition costs associated with growth nearly double! So despite the declining CAC numbers related to the most recent three months of the business, the company has done more to prove that it’s seeing diminishing returns on investment capital today, rather than seeing increasing returns. To an investor seeking to maximize g, doubling down on highly diminishing returns is not a great way to get there.
—
So if you’re looking for a takeaway here, it’s that every success at the early stage should feel like eating a bowl of chocolate frosted sugar bombs — delicious, but with a diminished pleasure by the anticipation of future bowls. New products, revenue streams, strategies, key hires and best practices should always be on the horizon driving increasing returns, and boards should aggressively push for that increasing growth despite the increasing challenge to deliver it as you scale. Because at the end of the day, growth is the ultimate determinant of terminal value to a startup.